Debugging
Debugging in programming is the process of identifying, analyzing, and fixing errors (bugs) in a computer program. It involves running the code, detecting issues, and correcting them to ensure the program behaves as expected.
Knowing how to debug can also make you understand a new code base faster and with more ease. In the following, there are a three debugging techniques, explained with advantages and disadvantages.
- Print statements or loggers
- Breakpoints
- Graphical debugger
This guide should help you to get a first insight into debugging and can be a starting point before searching the internet for more information about advanced techniques.
Print statements or loggers
The most easy way to find out what an application is doing, is by adding print statements or logging to the code. Let us say we are having the following code:
if __name__ == '__main__':
    x = 5
    y = x + 1
    print(x)
Adding the print statement like this is the most intuitive way to find out more about the state of our application. Likewise, the print statement can also be replaced by a logger on a very low verbosity to catch all related debugging messages.
from tergite_autocalibration.utils.logging import logger

logger.debug("A message to be only printed while debugging the application.")
Consider reading more about the logger before starting.
Advantages
- It is very easy to add the print statement.
- You can easily add print statements even when you are using console based editors.
Disadvantages
- If you add too many print statements, the console output can become very verbose
- You have to know in advance what you want to print. Let us say, in the example above, you wanted to print
yas well and it would take a long time to compute other things before you reachyin the code, you are loosing a long time to wait. - You have to define print statements also for more complex variables.
Breakpoints
To overcome these issues, Python offers built-in support for so-called breakpoints. The idea behind a breakpoint is simple. The code will execute until it reaches the breakpoint. Then it will open an interactive console where you can use the variables defined in this very moment of the execution in an ipython manner. Like that, you can print values and explore variables a bit more flexibly.
class AdvancedObject:

    def __init__(self):
        self.var_a = 0
        self.var_b = 1

if __name__ == '__main__':
    x = 5
    y = x + 1
    advanced_object = AdvancedObject()

    breakpoint()
The extended example now uses the breakpoint instead of the print statement. When you run the code with the pydb command, it will open the ipython-like console when it comes to breakpoint.
python pdb my_script.pyYou can find more information about the python debugger in the official documentation for pdb and this tutorial.
Advantages
- Lets you find out more about the state of the application in an interactive way.
- Not much more complicated than the print statements.
- Part of the Python standard library.
Disadvantages
- You still have to remove the breakpoints afterward to clean up your code.
- For very complex objects, it is still complicated to discover their structure.
Graphical debugger
Modern IDEs nowadays usually feature a built-in debugger by default. The debugger often offers a way to evaluate expressions during runtime. Breakpoints can be set just for the IDE itself even during runtime, and they are usually not destructive i.e. part of the codebase.
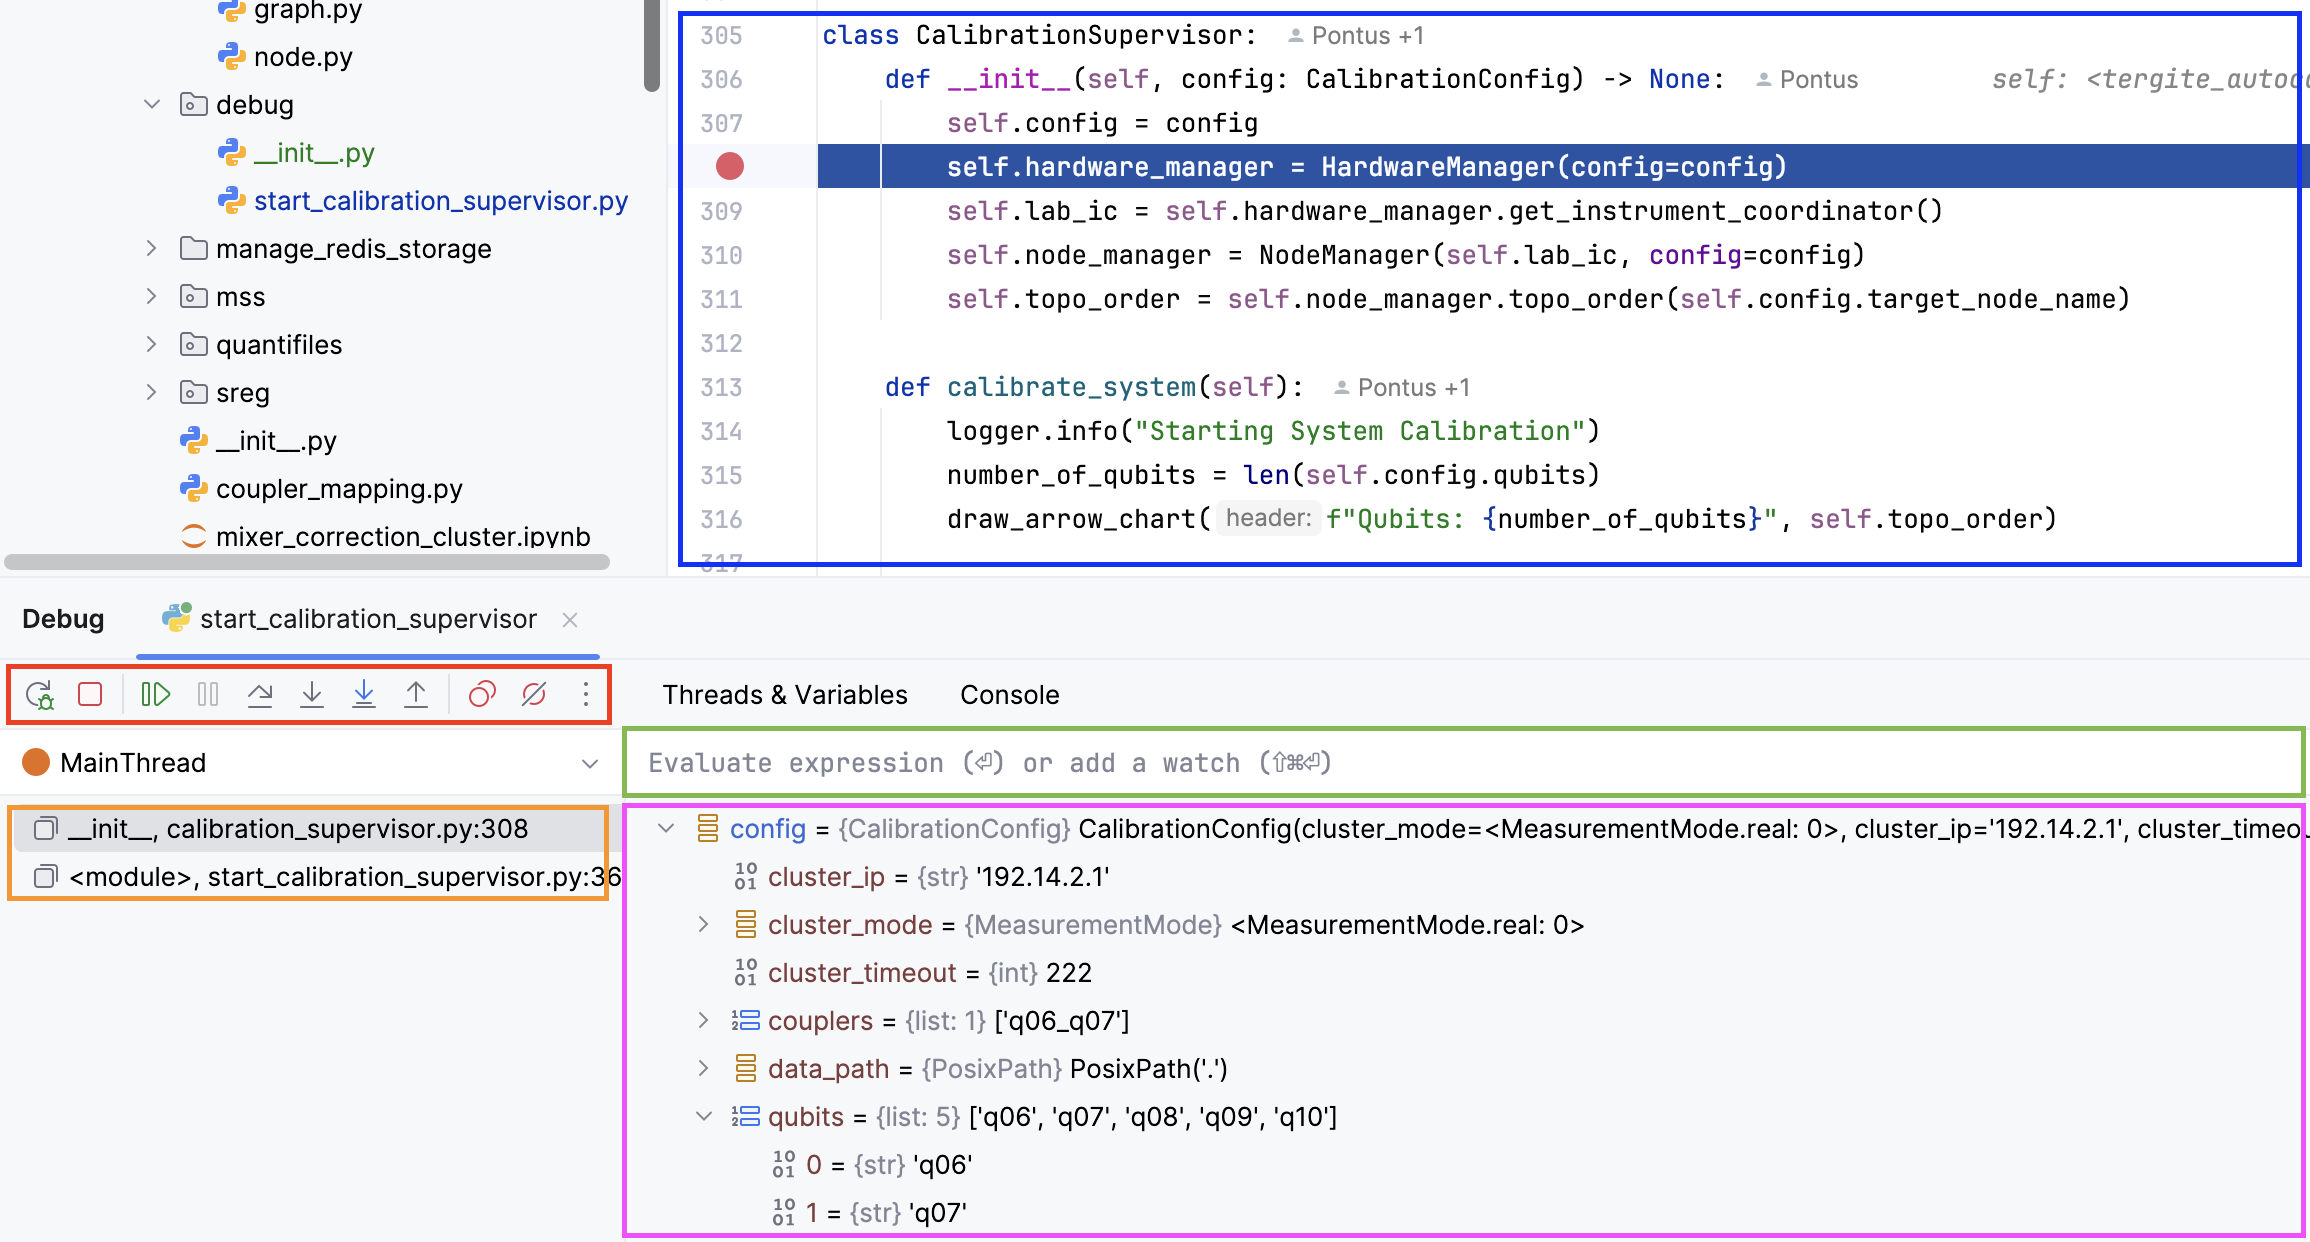
On the picture above, you can see how the graphical debugger looks like in PyCharm. There are five important areas:
- blue: This is inside the actual code. The red dot marks the position in the code, where it should halt during execution.
- red: On this panel, you can control the code execution. There are buttons to restart, stop, continue to the next breakpoint, halt, go to the next line and more. The choices might vary for each IDE.
- orange: Since the function you are inside can possibly been called by another function outside, on the orange panel there is a stack trace where you can navigate between the contexts.
- pink: This section shows the local and global variables active for this current context. You can easily explore objects and nested structures.
- green: In case you want to evaluate a variable or try some code, you can run it in the evaluation box. This will execute your code on top of the state your application is in at this very moment. This means you can use all defined variables and play around with them.
Learning how to use such a debugger is super easy. It is a real game changer and will save you a lot of time while trying to figure out why your code is hanging somewhere. For more information check out these guides for VSCode and PyCharm.
Advantages
- You can easily explore very complex states of your application.
- No need to remove print statements or breakpoints.
- Most IDEs include a debugger out of the box.
Disadvantages
- The code execution might be a bit slower than usual.
- Sometimes the debugger introduces errors, or you will end up in a strange state. Especially, when working with multithreaded applications. However, this does not happen very often and will probably not happen for the automatic calibration.
Next steps:
This article introduced some methods on how to debug applications and deal with errors. If you are interested in more techniques, consider reading about:
- Rubber duck debugging
- Code reviews
- Or continue with the next article about writing documentation